

ELMO CRT
ELMO's Custom Reporting Tool (CRT) enables employers to create custom reports from data in their ELMO solutons.
Overview
Responsibilities
Stakeholder interviews
- Analytics
- Data synthesis and sense-making
- Competitive analysis
- User journeys
- Wireframes
- Visual design
- Prototyping
- Usability testing
Opportunity
I took the initiative to improve the Custom Reporting Tool's (CRT) Report Builder and Overview Dashboard experience within the short period of time given.
Research
I participated in customer engagements, gathered CRT online survey responses, along with direct customer feedback, and conducted quantitative research via our analytics tool, Amplitude.

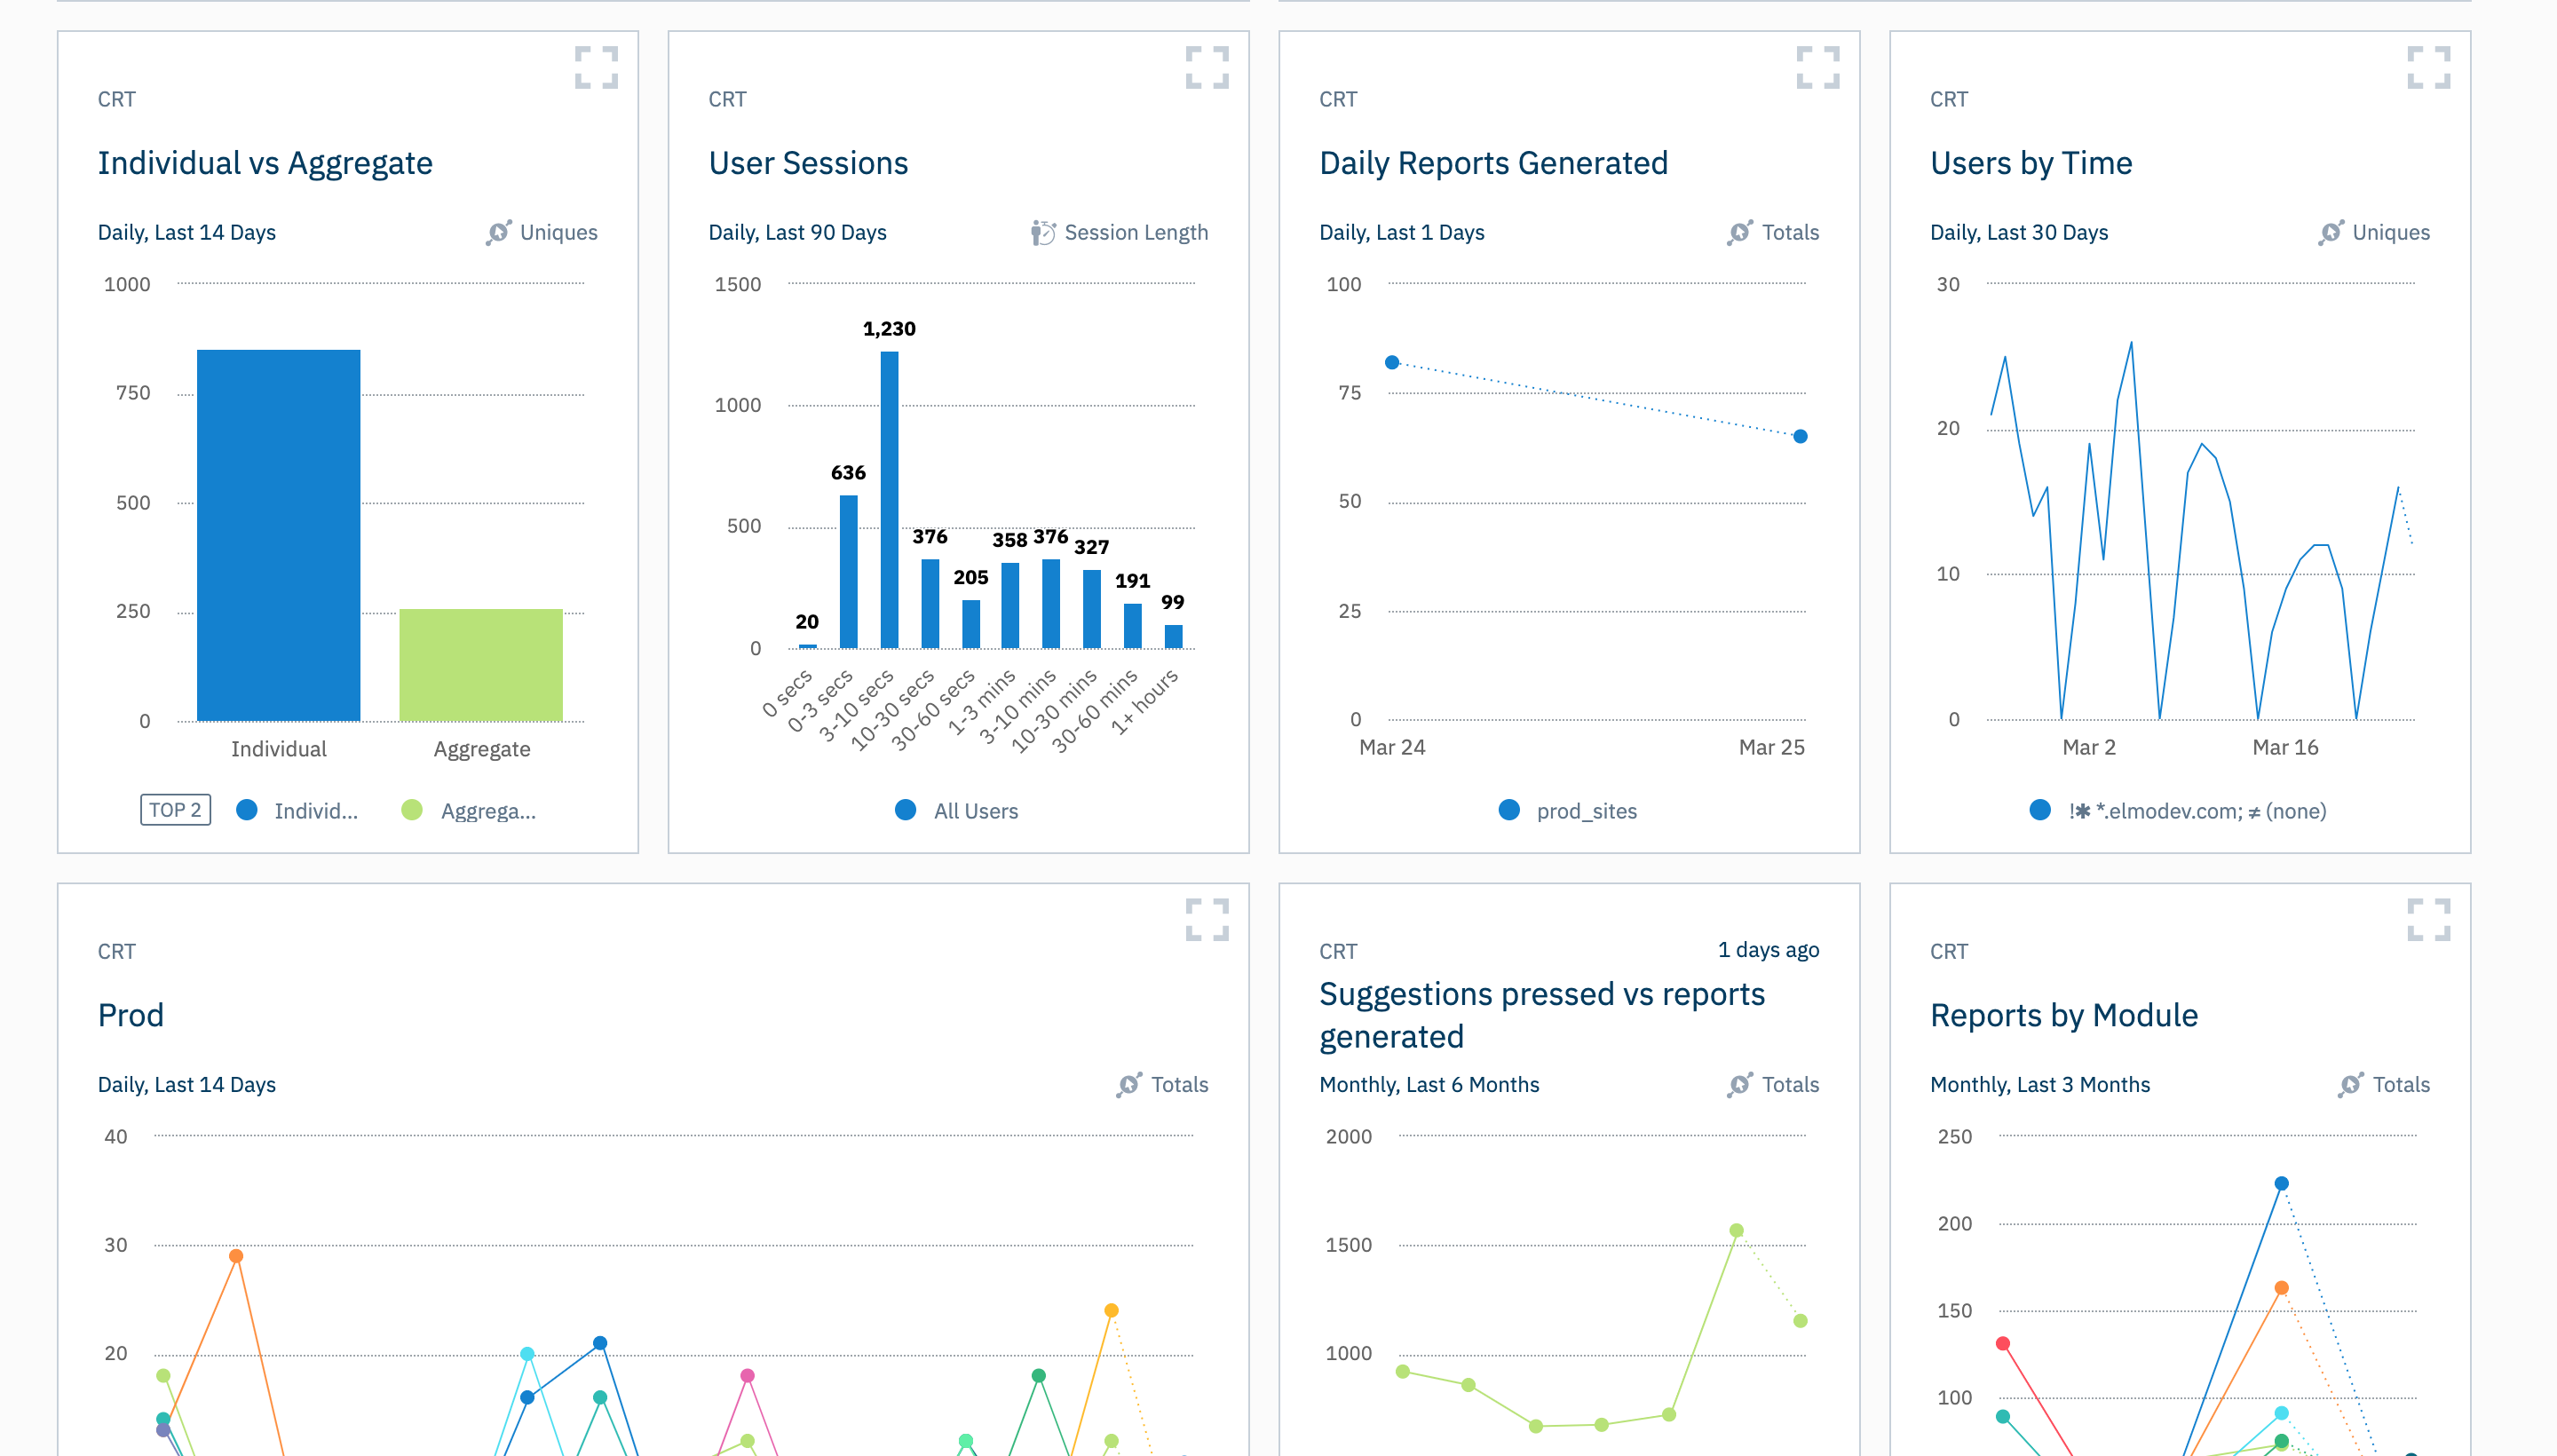
After synthesis we found the following problems could be addressed in the short term: misunderstanding of ELMO's database structure; no report comparison; and some common functions were hidden or counterintuitive.
Design
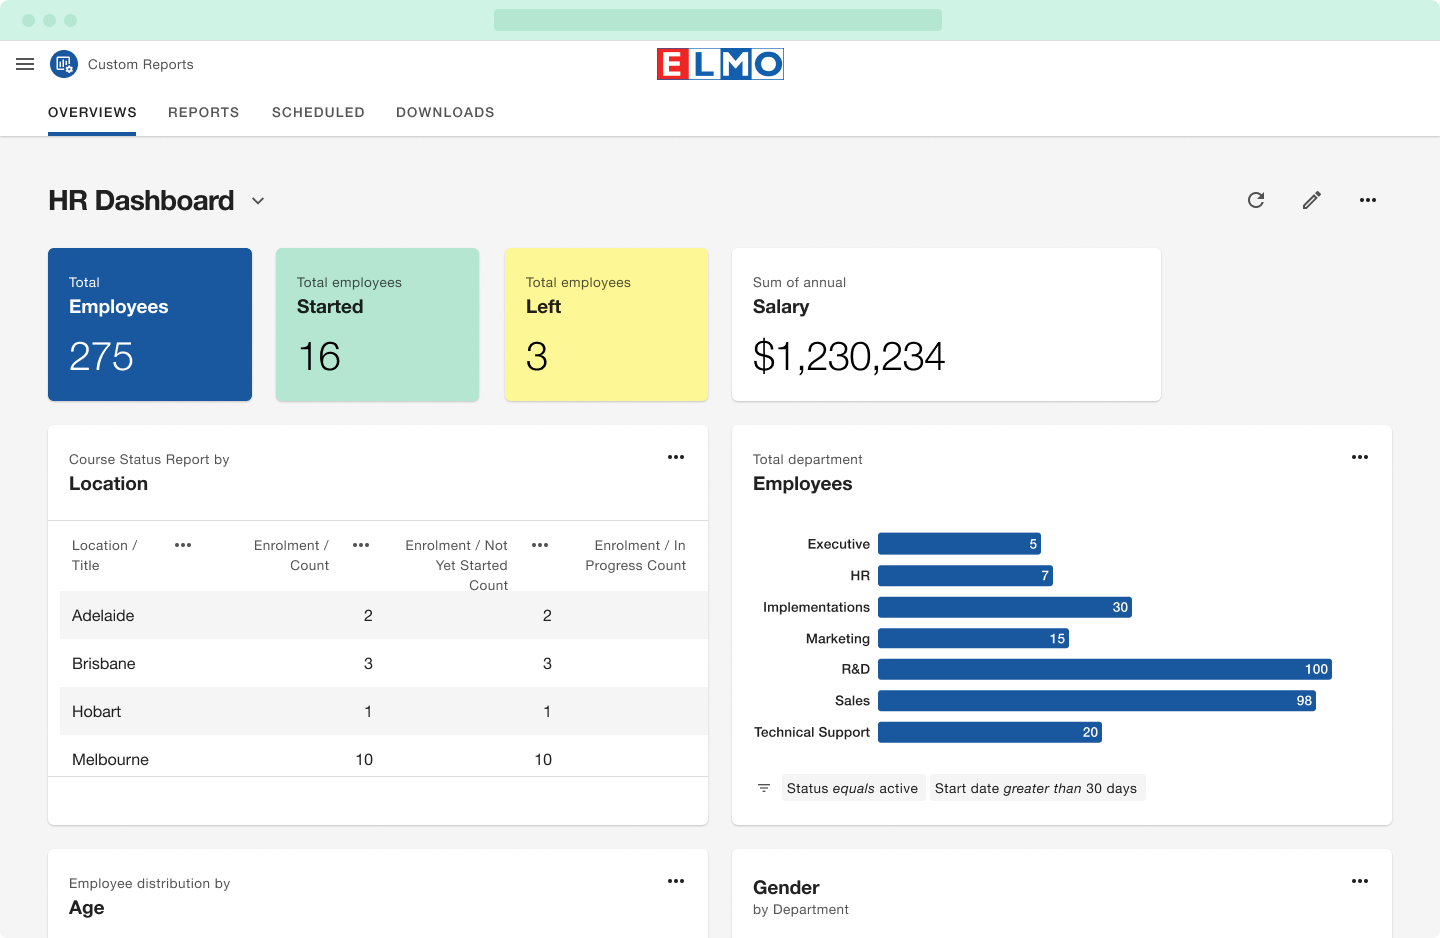
A new dashboard experience was created allowing customers to: view and compare multiple reportable widgets at once; resize, add and remove widgets; and create multiple dashboards.
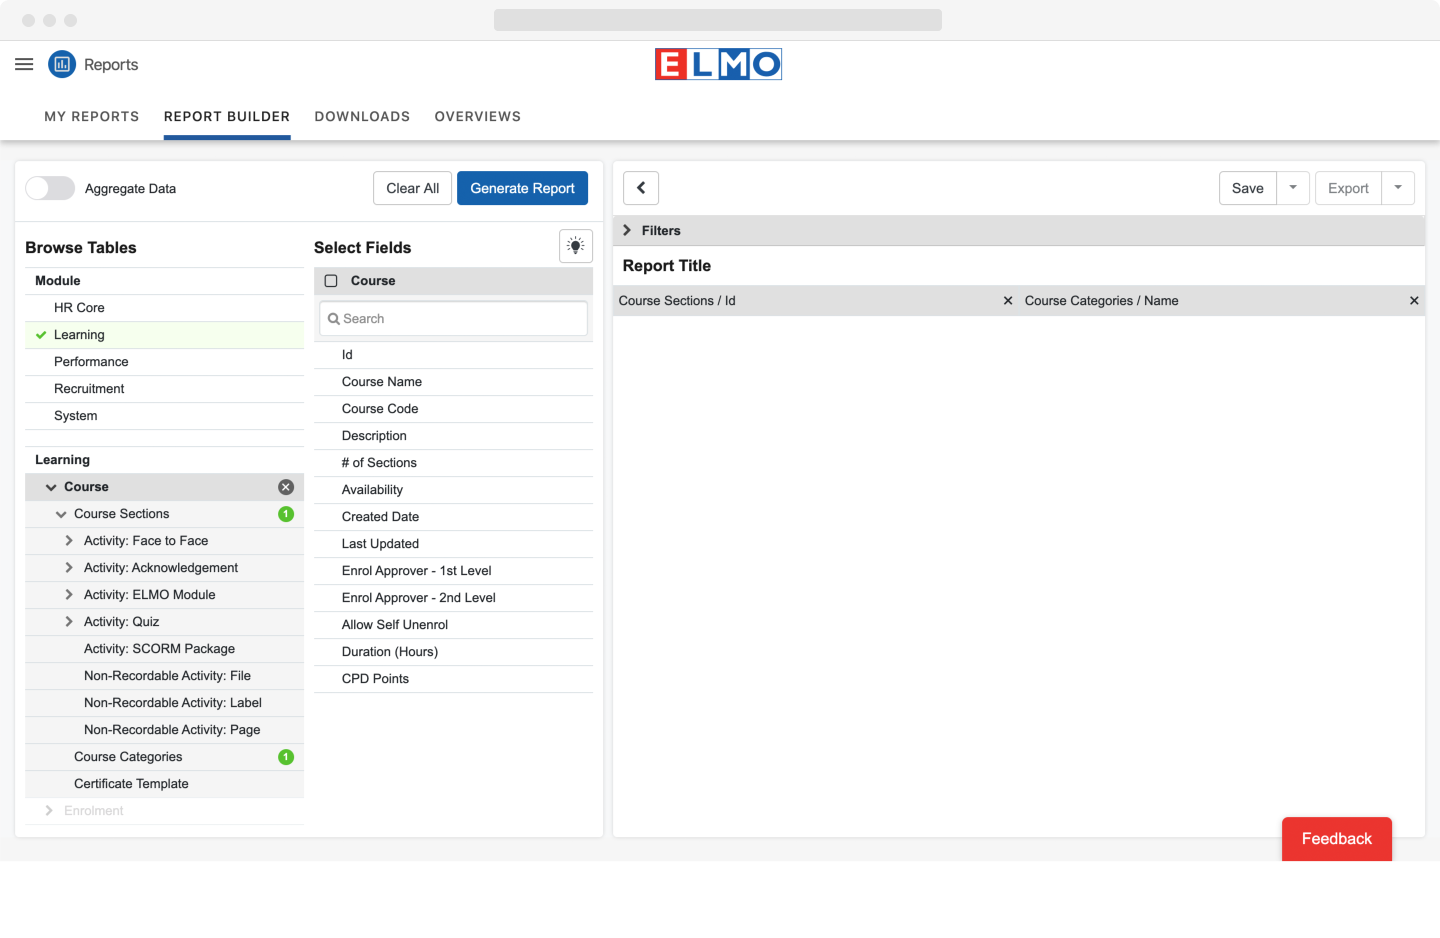
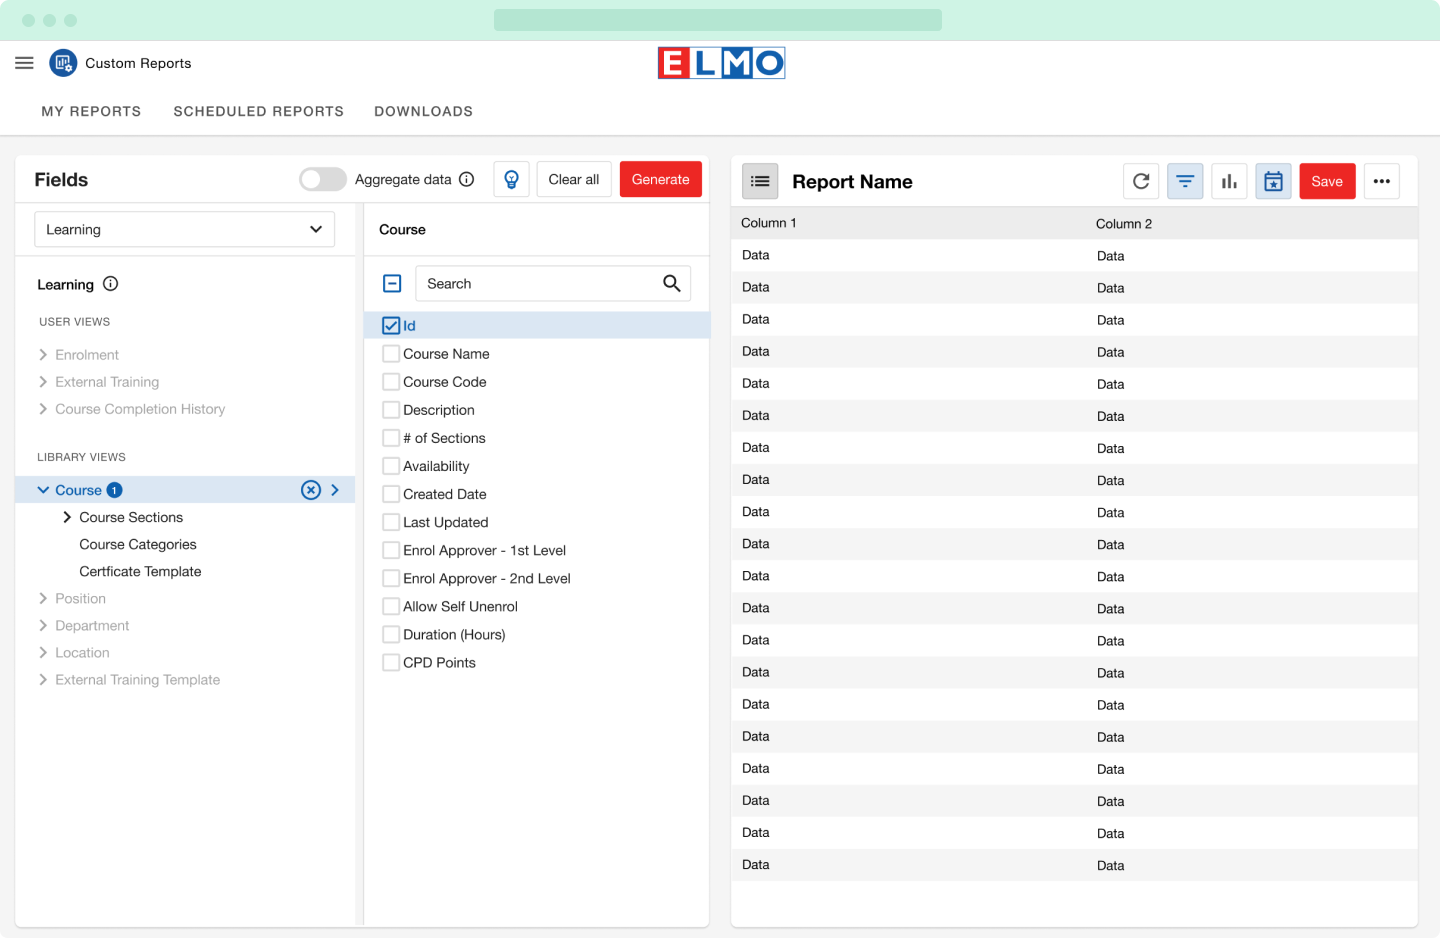
I went about making the Report Builder's UI more informative with information pop-ups and categorising datasets. Functions were improved and made visible to reduce the user's cognitive load.
Validate
The prototypes were guerrilla tested and presented to the business in our monthly showcase event and to our visiting customers. The overall feedback was highly positive. “We love the dashboard! When can we have it?”
Further validation was to be done post launch using Hotjar and Amplitude.
The Team
Senior Product Manager Asha Nair
Business Analyst Graham Crawford
Engineering Manager Ronan Whelan
Software Engineer Gillian Ng
Software Engineer Raymond Ho
Software Engineer Nicholas Maddalena
Software Engineer Sumit Banskota
Special Thanks
Senior UX Designer Verica Nikolic
UI Designer John Rattanachaya
Account Manager Greg Shandler
Other Works
Sage ESS TimesheetsCase Study
ELMO Design SystemCase Study

ELMO Report SchedulerCase Study
ELMO SurveyCase Study
Sage ESSCase Study

© 2022 GABS
